Unemployment in U.K. in mid-january of 2012 was about 8.3%, 2.67 million people. And 1.3million people were underemployed, meaning that they were in part-time work but unable to find full-time work.
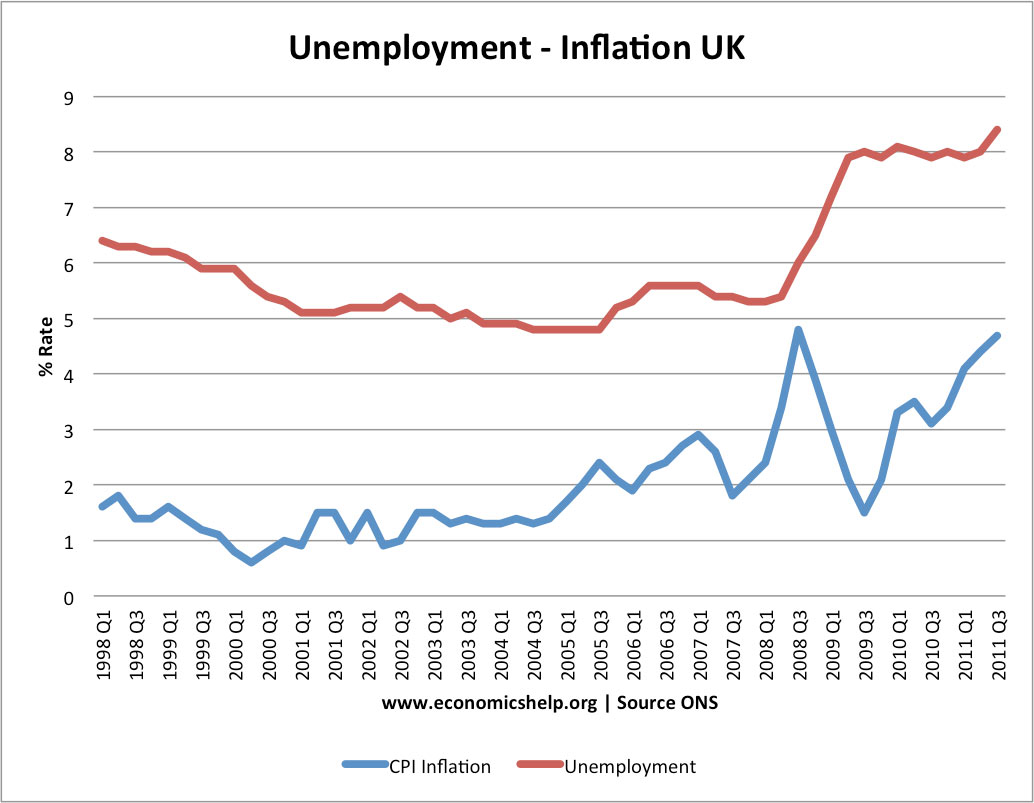
The graph above shows the drastic change in unemployment rate in 2008 and since then, the unemployment rate remained high, about 8%. Also, the CPI inflation rate was the highest at 2008, reaching nearly 5%. After than, the inflation rate is changing drastically, going down to 1.5% in 2009, and increasing since then.
There are few causes of inflation. Inflation is caused when there is too much money in circulation, when there is more demand for goods than can be met by the available supply, and when the workers' wages, raw material prices, and import prices increase.
http://www.economicshelp.org/blog/1622/inflation/inflation-rates-in-uk/
http://whatisinflation.uk.com/

